A Two-Map Afternoon: Comparing Neighbouring Counties
Compare neighbouring counties on maps to see how landforms and settlements are arranged, using a simple side-by-side method that makes contrasts easier to describe.
Comparing neighbouring counties on maps is clearest when both maps show the same kinds of features at a similar scale. Put the maps side by side and compare how landforms and settlements are arranged within each county, rather than treating the shared boundary as the main story.
What do I need for a county map comparison?
Choose two maps that show both counties in full, with legible boundaries, place labels and landform symbols. An atlas, a paper county map or a digital map service can work. If you use a screen, open the maps in separate windows and match their zoom levels as closely as you can.
Check each legend before comparing colours or symbols. One map may use shading for elevation while another uses contours; differences in display can look like differences in the land itself. A notebook, pencil and simple two-column table are enough to record what each map shows.
- Check that both maps show the full county outlines; if one is cropped, choose a broader map before comparing overall shape.
- Check that the scale and level of detail are similar; if one map shows streets and the other only towns, switch to matching map views.
- Check each legend for landform colours and settlement symbols; if the symbols differ, translate them into plain notes rather than comparing their appearance.
- Check that both maps label the same kinds of places; if one omits smaller settlements, compare only the settlement types both maps display.
- Check that the shared edge and internal features are visible; if labels obscure them, use a second map layer or a clearer map before drawing conclusions.
- Check whether a feature is missing or merely not shown at that scale; if the map is silent, record “not shown” instead of treating it as absent.
How do the county shapes compare?
Start with broad proportions. Describe each outline as compact, elongated, broad, narrow or irregular, then note where it changes shape. These are working descriptions, not formal categories.
Compare the outlines against internal features. Does a river run across the broad part of one county? Does a band of hills sit close to an edge in the other? A quick, rough sketch can help you see whether a feature occupies a similar position in both counties without getting caught up in tracing every bend.
Where are the landforms arranged?
Look for uplands, valleys, lowlands, coast, marsh or other features shown by the maps. Record whether each is near an edge, across the middle, or concentrated in a smaller area. Then compare position and pattern: two counties may both contain hills, but one may have a continuous upland area while the other shows scattered patches.
Keep the map’s display choices in view. If one map uses contour lines and the other uses broad colour bands, compare the general location of high and low ground, not the visual density of the symbols. When the information is too different to match, mark that comparison as uncertain and use a map with a more comparable legend.
How are towns and villages distributed?
Compare the placement of settlement labels rather than connecting them in a travel sequence. Look for clusters around a centre, groups along a coast or valley, and larger areas with fewer labels. Note which kinds of settlement each map includes, since a map that labels villages can appear denser than one focused on larger towns.
A blank-looking patch is not proof that nobody lives there. It may reflect the map’s scale or labelling choices. Write down what is visible, such as “town labels are concentrated in the eastern part”, and leave explanations about why for another source.
How do you make a fair side-by-side comparison?
What if the maps use different colours?
Read both legends and compare the landform categories they share, such as upland and lowland. If their categories do not match, note the mismatch and avoid treating colour differences as differences in terrain.
What if one map shows more settlements?
Check its scale and symbol key before comparing density. If it includes smaller villages, restrict your comparison to the settlement types shown on both maps or find a map with a matching level of detail.
Should I include the shared boundary?
Include it as a reference point for locating features, not as an explanation of the counties’ internal patterns. Note what lies near either side of the edge, while keeping the comparison focused on the arrangement within each county.
What should I do when a feature is not shown?
Write “not shown” and check a second map if the feature matters to your comparison. Do not convert missing map information into a claim that the feature is absent.
What does a worked comparison look like?
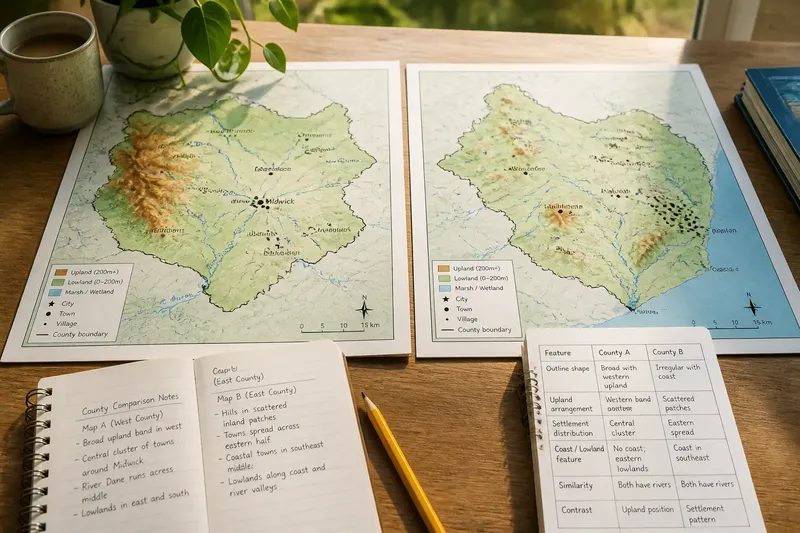
Say you have two invented county maps, both using similar shading and town symbols. On Map A, you can see a broad area of upland in the west and a group of town labels near the centre; on Map B, hill symbols appear in separated inland patches and the town labels are spread across the eastern half.
First, you check both legends and confirm that the maps use comparable symbols. Next, you enter “western upland band” and “central town cluster” for Map A, then “scattered inland hills” and “eastern spread of towns” for Map B. The resulting comparison is that Map A’s landform and settlement patterns are more concentrated in particular zones, while Map B’s are distributed differently. That describes the map arrangement without claiming why it developed or how to travel between places.
How should you record the comparison?
Use a small table with one row per feature and one column per county. Keep each entry specific and separate observation from question.
- Check whether the outline is compact or elongated; if the contrast is clear, record both descriptions, but if the maps are cropped, replace them before comparing shape.
- Check where upland shading or contours appear; if the legends match, compare their positions, but if they do not, mark the landform comparison as uncertain.
- Check where settlement labels cluster; if both maps use comparable symbols, describe the distribution, but if one includes more settlement types, compare only the shared types.
- Check whether each county has a visible coastal, valley or lowland feature; if shown on both maps, compare its position, but if missing from one, write “not shown”.
- Check one similarity as well as one contrast; if you can support both from visible features, record them, but if not, use a second map rather than filling gaps with guesses.
For example, “both maps show towns near a river” is an observation if the symbols and river are visible on each. “The river caused the towns to grow there” is a separate explanation and needs evidence beyond the map comparison.
How can you keep the comparison focused?
Choose a few shared features—outline, landforms and settlements are a useful starting point—and stop once you have clear paired observations. Add place names only when they help identify a location or prompt a question about the map; a name alone does not explain the surrounding pattern.
Keep the maps, sketches and notes together. The useful result of comparing neighbouring counties on maps is a clearer description of how each county’s land and settlements are arranged, with any gaps in the maps made explicit rather than guessed away.